


The last decade and financial crises exposed sufficiently the vulnerability of Russia’s export growth when it faced the external shocks. Basing on the Amurgo-Pacheco and Pierola’s definition and method, we applied the HS-4 international trade data for 2007-2012 years to describe and analyze the dual margin of Russia’s export. We found out that Russia export growth mainly depends on the intensive trade margin, the share of extensive margin is very poor. The obvious bias to the intensive margin of Russia helped us to see and understand the wick sides of Russia’s export structure and why it is easily affected with external shocks.
Key words: Russia, export growth, intensive margin, extensive margin
After the collapse of the Soviet Union Russia started with much distorted trade structure, which was characterized with the lack of geographic diversification (because of the Soviet Block limitation) and by products (due to high level of production specialization). Union countries did not have trade relationships with other world, they carried out trade with the soviet states. So, the reasons for Russia to start a diversification of trade were quite clear. Making its export more diversificated, Russia will be less sensitive to the market shocks. It will decrease the risks from the demand of the trade partners. As a result it makes more stable income from trade. There are some papers that can show the positive relationship between the level of export diversification and economic growth (Lederman and Maloney, 2007). There are also studies about developing economies with similar results (Funke M., 2003).
Analyzing the diversification of the economic growth and its dynamic, modern researchers define two types of diversification – extensive and intensive. Extensive economic growth is a growth of social production by the increasing of production factors without their quality changes (number of employees without increasing their qualifications; capital investments without corresponding technology improvements; consumption of material factors of production such as raw materials, fuel, land without increasing of an efficiency of their use). The extensive economic growth keeps ratio between the rate of real output’s growth and the real total costs of its creation constant.
Intensive economic growth is the increase of national production by more efficient (intensive) use of existing production factors (such as application of the achievements of scientific-technological progress to production; improvement of the organization of production - a new structure of economic relations, management, marketing, cooperatives – and as a result, improvement of its effectiveness; growth of the qualification of labor force and the improvement of the labor scientific organization. Intensive economic growth lets the growth rate of the real output exceed the rate of change of total production cost.
The objective of this paper is to investigate how Russia depends on the extensive and intensive margins and the importance of each margin for the export growth and economy stability. For this purpose 4-digit level trade data for Russia was analyzed, that covers the period from 2007 to 2012 (Data is taken from United Nations Commodity Trade Statistic Database).
In the modern empirical literature there is no definite conclusion about the role of the extensive and intensive margin in the export growth rate. Some authors emphasize that extensive type provides the export growth more. At the same time, according to some papers the intensive margin is a key factor of the export growth (Felbermayr, Kohler, 2006; Helpman, Melitz, Rubinstein, 2008) [3, p. 375]. Nevertheless, authors use different approaches to the definitions of the extensive and intensive margins what can cause different results as well.
Our understanding of the role of margins to the export growth builds on the empirical research made by Besedes and Prusa (2010). They deepened the meanings of margins, describing intensive margin as “having relationships survive/persist and having existing relationships deepen” [1, p. 377]. Thus, authors took into account the importance of the ability of trade relationships to survive. The authors analyzed export relationships between the countries and found its short period of duration (most part of them did not exceed 2 years). Mostly it concerned the developing countries, but they did not give explanations which factors foster trade along two margins. However, they concluded the leading role of intensive margin in the export growth, what characterized with the long existing trade relationships.
Amurgo-Pacheco’s (2008) work also investigates the export diversifications for developing countries. They also took attention to the different explanatory variables such as GDP of the state or distance and their possible influence on the dual margin. As the result, they extended the term of extensive margin – they added geographic dimension and distinguishes it into products extensive margin (export of new gods to new markets) and geographic extensive (export of old gods to new markets). Besides, main finding made by authors was that the intensive margin mostly explains the export growth of the developing countries [2, p.21].
Russia belongs to the developing economies. It should be mentioned that the studies about the importance of two margins for the transition economies already exist. At the same time, there is a lack of studies examining the case of Russia.
Considering existing literature, the definitions of the intensive margin are basically the same, what means that modern export enterprises and modern export products extend in one direction and in the same volume as well. But concerning the definition of the extensive margin, there is no common opinion among the researchers. Helpman et al. (2008) and Felbernayr & Kohler (20060 believe that the expansion of trade margins refers to the establishment of new trade partnerships between the exporting countries and other states. Hummels & Klenow (2005) after the trade decomposition concluded the extension of the export products as the main characteristic of the extensive margin.
Considering that we apply HS6-digit level trade statistics for the period from 2007 to 2012, it is more appropriate to use the perspective of the product categories to decompose the trade into two margins. Our definition of the intensive margin will be based on the definition made by Amurgo-Pacheco & Pierola (2008): the products have been exported before to the markets have been exported before as well (old products and old markets). If  is equal to the products i exported from Russia to the other states d in 2007, and there is
  . If in 2012 these products are still being exported from Russia to d sates, then in this case, the intensive margin can be thought as
From the other side, we will define the extensive margin as: export of the already have been exported products to the new markets (old products - new markets), and the export of the before have not been exported products to the new markets (new products – new markets). Therefore, if  is the products j exported from Russia to other d state in 2007,
  , then j is the export products from Russia to the new countries s in 2012; at the same time,
  presents the export flow of products
  from Russia to the other o states in 2012, but there is no these products in
  , then in 2007 there were no export flow of product k from Russia to the states o. Then in this case, the extensive margin can be presented with
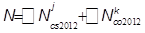
According to the above definitions we can decompose the Russia’s export growth into extensive and intensive margins, moreover to analyze its structure and main characteristics.
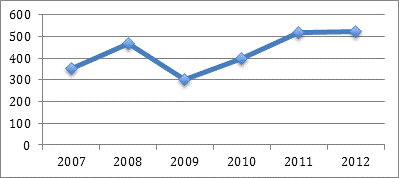
First of all, we should examine the statistics on exports of Russia for the period under review. First of all, we can observe from Figure 1 that Russian export is increasing over the years. The total level of export has increased more than 40% during the period (measured in USD). Meanwhile, we can see the decrease in total exports after 2008, which can be explained with the beginning of the financial crisis. But the dynamic of the last two years under review it is obvious that Russia has good prognoses. Besides, the increase of the total value of export can be explained with the increase of the average prices mainly of the oil, petroleum products and natural gas.
Figure 1. Value of Russia’s export (2007-2012)
Next figure shows the main trading partners of Russia in 2007 and 2012. In 2007, the main trading partners of Russia were Netherlands, Germany and Ukraine. The total trade share of them accounted for 20% of total export. In 2012 Netherlands and Germany kept their trade share, but China took the second place of the key-trading partner, accounting for 8% of total export. It is interesting to note that these destinations of export are mainly due to export of mineral products and metals. Around 70% of Russian export to China is export of mineral products (crude, asbestos, oil, coal briquettes, and iron ore). In case of Netherlands and Germany the percentage is even bigger – about 85% and 75% respectively.
Figure 2. Main export destinations for Russia (2007-2012)
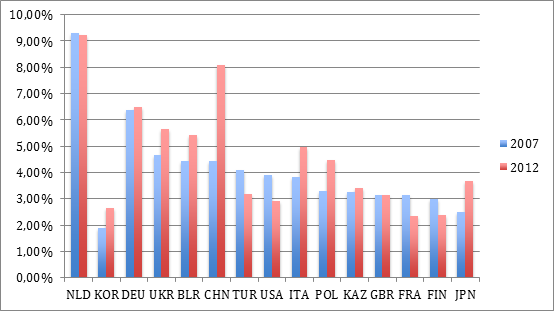
Table 1 presents Russia’s top 10 export products in 2007 and 2012. As we can see, Russian export structures have not changed a lot. In these two years top exported products were Crude Petroleum, Oil and Oil gas, accounting for around 60% of overall export. So, it is obvious that Russia uses natural resources as its key export products. Moreover, for the period under review, export structure of Russia continues to show the increase of the monopoly tendencies among fuel and energy companies.
Furthermore, petroleum and natural gas dominate over the export of Russia for this period, accounting for about 65% of Russia’s export value in 2012 – an outcome of export volumes and higher commodity prices. Export growth shares of the nonoil and gas sector are also notable. Such industries as machinery, electronics, transportation equipment, and chemicals reached combined growth share in export value of more than 10%. It can be rather positive comparison, however, important structural limitations in Russia’s trade performance still exist.
Table 1. Top 10 export products of Russia in 2007
|
# |
HS |
Name |
Value (USD) |
Percent |
|
1 |
2709 |
Crude Petroleum |
$121,055,588,875.17 |
34.34% |
|
2 |
2710 |
Oil |
$47,066,764,167.65 |
13.35% |
|
3 |
2711 |
Oil Gas |
$42,601,926,137.38 |
12.08% |
|
4 |
7502 |
Raw Nickel |
$8,936,493,145.97 |
2.54% |
|
5 |
7601 |
Raw Aluminium |
$8,749,298,184.05 |
2.48% |
|
6 |
7207 |
Semi-Finished Iron |
$6,987,994,475.73 |
1.98% |
|
7 |
2701 |
Coal Briquettes |
$6,896,238,060.24 |
1.96% |
|
8 |
1001 |
Wheat |
$4,395,274,637.01 |
1.25% |
|
9 |
4403 |
Rough Wood |
$4,241,823,060.08 |
1.20% |
|
10 |
7208 |
Hot-Rolled Iron |
$3,519,854,616.52 |
1.00% |
Top 10 export products of Russia in 2012
|
# |
HS |
Name |
Value (USD) |
Percent |
|
1 |
2709 |
Crude Petroleum |
$183,748,483,270.08 |
39.07% |
|
2 |
2710 |
Oil |
$70,646,329,764.51 |
15.02% |
|
3 |
2711 |
Oil Gas |
$42,892,842,942.02 |
9.12% |
|
4 |
2701 |
Coal Briquettes |
$14,074,751,682.84 |
2.99% |
|
5 |
7207 |
Semi-finished products of Iron |
$6,997,125,669.00 |
1.49% |
|
6 |
7601 |
Raw Aluminium |
$6,638,717,814.91 |
1.41% |
|
7 |
1001 |
Wheat |
$6,211,815,617.74 |
1.32% |
|
8 |
7108 |
Gold |
$5,845,782,823.11 |
1.24% |
|
9 |
7102 |
Diamonds |
$4,677,077,906.20 |
0.99% |
|
10 |
3105 |
Mixed mineral or chemical fertilizers |
$4,255,016,510.81 |
0.90% |
Table 2 presents the trend dynamic of the number of exported products. In 2007 Russia exported 1208 products of 4-digit categories. By 2012 this number was reduced to 1190. Although, Russia showed the export growth among some industries (precious metals, vegetable products, chemical products, animal and vegetable Bi-products, etc.), it is interesting to note that during 6 years country stopped to export 18 products. It means that Russia’s export does not have proper product diversification. Such industries as wood products, metals, art and antiques decreased their share in overall export. So, the lack of the diversification of export structure and the growth of share of other industries can be explained with the adherence of Russia to the intensive margin of trade – increasing of export of old products to old markets.
Table 2. The dynamic of export for industries.
|
Industry |
2007 (USD) |
2012 (USD) |
Industry |
2007 (USD) |
2012 (USD) |
|
Mineral Products |
224B |
319B |
Footwear and headwear |
58,8M |
126M |
|
Wood products |
9,19B |
7,06B |
Animal hides |
389M |
516M |
|
Metals |
56,1B |
46,8B |
Textile |
815M |
758M |
|
Stone and glass |
1,05B |
1,27B |
Transportation |
6,01B |
7,77B |
|
Paper goods |
3,53B |
3,8B |
Machines |
9,93B |
12,7B |
|
Animal and vegetable Bi-products |
702M |
2,3B |
Arts and antiques |
323M |
103M |
|
Vegetable products |
5,48B |
9,22B |
Precious metals |
5,72B |
15,1B |
|
Animal products |
2,09B |
3,79B |
Chemical products |
18,6B |
26,6B |
|
Foodstuffs |
2,86B |
4,41B |
Instruments |
990M |
1,53B |
|
Weapons |
132M |
194M |
Plastics/rubbers |
4,1B |
6,52B |
|
Miscellaneous |
608M |
632M |
|
|
|
After examining the dynamic of new/old products and new/old destinations separately we can analyze them as the combinations, what are intensive and extensive margins. Table 3 presents percentage shares of intensive and extensive margins in overall export growth of Russia for the period from 2007 to 2012. From the Table it is obvious that main driver of the export growth, as it was mentioned above, is intensive margin. In 2007 share of intensive margin was 96,16%, each year this share was increasing and in 2012 it reached 98,39% of overall trade. The extensive margin has much less significant role in overall growth level. Its share never reached even 4%. Among the types of the extensive margin, it is obvious that Russia had attempts to produce new goods and find new markets. The lack of zero shares among extensive margin’s types in 2012 shows the good tendency for Russia’s export. But still we can see the adherence of the country to the keeping old partners and products.
Table 3. The shares of intensive and extensive margins in the export growth of Russia
|
2008 |
2009 |
2010 |
2011 |
2012 |
|
|
Old Product/Old Market |
96,16% |
99,85% |
99,87% |
99,91% |
98,39% |
|
Old Product/New Market |
3,76% |
0,08% |
0,08% |
0,03% |
0,71% |
|
New Product/Old Market |
0,04% |
0,07% |
0,05% |
0,06% |
0,89% |
|
New Product/New Market |
0,04% |
0% |
0% |
0% |
0,01% |
Thus, Russia’s trade happens mostly along the intensive margin. It means the country remains to export old products to the old destinations. A closer review of Russia’s trade composition hints at a lack of diversification of new destinations and a narrow product base. Decomposition of export growth from 2007 to 20012 highlighted it and showed how trade flows of existing products to old trading partners accounted for more than 95% of the overall growth.
Moreover, our analysis revealed the difficulties for Russian exporters. They face it not only when enter the foreign market, but also when it concerns the sustaining of their presence in it. Although, Russia during the period under review managed to get 6 new trade partners, however, some export “mortality” still exists. It indicates at the lack of international competitiveness in various sectors. It can be explained with a situation of unstable economic environment these years, high volatility of demand and supply for certain products in world markets, as well as in terms of a membership of Russia in the WTO and it’s possible influence on the certain problem sectors (agriculture, engineering) there is a problem to achieve a stable level and diversification of exports.
Meanwhile, the export orientation of Russia on the limited number of export product groups indicates the further monopolization of the export-oriented industries, a weak investment activity in the competitive production areas. Currently, the scientific study of the export diversification of Russia, as a full member of WTO, is new, therefore, the assessment of the dynamics, identifying of the trends of the structural changes of Russian exports are relevant.
References:
1. Tibor Besedes, Thomas J. Prusa. The role of Extensive and Intensive Margins and Export Growth//Journal of Development Economics, Vol. 96 (2), 2010, pp. 371-380.
2. Amurgo-Pacheco A., Pierola M.D., Patterns of Export Diversification in Developing Countries: Intensive and Extensive Margins//The World Bank, International Trade Department, 2008.
3. Hummels D., and Klenow P. , The Variety and Quality of a Nation's Exports//American Economic Review, American Economic Association, vol. 95(3), 2005, pages 704-723.
4. Андрей Каукин, Лев Фрейнкман, Структура и продуктивность Российского экспорта 1999-2006 [Электронный ресурс] – Режим доступа: http://iep.ru/files/text/policy/2009_5/kaukin.pdf
5. Rishav Bista, Three essaya on the role of extensive and intensive margin in international trade// University of Kentucky, UKnowledge, 2012, [Электронный ресурс] – Режим доступа: http://uknowledge.uky.edu/cgi/viewcontent.cgi?article=1005&context=economics_etds
6. International Trade Statistics Database, UN Comtrade, [Электронный ресурс] – Режим доступа: http://comtrade.un.org
