1. Introduction
1.1. Natura 2000 and the question of representation
Natura 2000 lies at the core of European conservation policy. It grew out of the Birds Directive and the Habitats Directive and gradually became the main territorial framework through which the European Union seeks to safeguard its most valuable habitats and species [1; 2]. The European Commission presents it as the largest coordinated network of protected areas in the world, while the European Environment Agency defines it more narrowly as an ecological network designed to ensure the long-term survival of Europe’s most valuable and threatened species and habitats [1; 2]. Those two descriptions are not identical, and that difference matters. One points to scale. The other points to purpose. Between scale and purpose, the real problem begins.
Protected-area research has long moved past the comforting idea that more protected land automatically means better conservation. A network may be extensive and still be uneven. It may cover a great deal of territory and still miss the places, gradients, or ecological concentrations that matter most. This is why representation remains such a persistent concern. Spatial coverage is only the first layer. Ecological representation asks something harder: whether protected areas correspond to conservation value, rather than to what was easier to designate, politically safer to approve, or less costly to protect [3]. In a network as large and heterogeneous as Natura 2000, that distinction becomes impossible to ignore.
1.2. Why mountains matter
Mountains make the representation problem sharper. They are not simply higher parts of the landscape, but tightly compressed ecological systems where altitude, slope, exposure, soil development, snow dynamics, and moisture balance interact over short distances. A few hundred vertical metres can reorganise habitat structure and species composition. That is why mountain regions are so often treated as biodiversity hotspots and as unusually revealing terrain for studying ecological gradients [3; 4; 5].
They are also important because elevational complexity may create climatic refugia, or at least refugial mosaics, where short-distance ecological adjustment remains possible under environmental change [3; 5]. Yet this does not make mountain systems secure. Recent work has shown how strongly mountain biodiversity is affected by warming, altered snow regimes, land-use change, and the compression of species ranges toward upper elevational limits [3; 5]. Their conservation value lies not in stability, but in richness, differentiation, and vulnerability. At the same time, mountains sit in a slightly awkward position in conservation debates. They are often treated as obvious priorities, but also as territories protected almost by default because they are steeper, colder, less densely settled, and harder to intensively transform. There is some truth in that. But only some. If mountain areas are heavily represented in a protected-area network, is this because they are ecologically indispensable, or because they are institutionally easier to protect? The two explanations may overlap, but they should not be collapsed into one.
1.3. The analytical gap
A good part of the literature approaches this issue only from one side. Some studies focus on the territorial extent of protection and ask whether mountain land is sufficiently covered. Others concentrate on particular taxa, habitats, or regional case studies [3; 4]. What appears less often is an approach that brings together three dimensions at once: the elevational distribution of protection, the biodiversity content of protected sites, and the difference between average ecological richness and cumulative biodiversity volume.
That last distinction is more important than it may seem. A high-elevation site may be unusually rich relative to its size, while lowland sites may still dominate the overall biodiversity load of the network simply because they are more numerous. Mean richness and total biodiversity volume are not the same thing, and they do not always move in the same direction. Until both are considered together, claims about underrepresentation or overrepresentation remain incomplete.
This study addresses that gap directly. It examines how Natura 2000 coverage changes along the elevation gradient across the European Union and relates that pattern to site-level biodiversity information derived from listed habitat types and listed species in the 2024 Natura 2000 tabular database [2]. The issue is not only whether mountain areas are well covered, but what that coverage actually means once biodiversity content is brought into the same frame.
1.4. Aim and research questions
The aim of this study is to assess how biodiversity is represented along the elevation gradient within the Natura 2000 network across the European Union.
More specifically, the article addresses five related questions. Are mountain areas spatially underrepresented or overrepresented in Natura 2000? How does Natura 2000 coverage vary across elevation bands, from lowlands below 500 m to sites above 3000 m? How does site-level biodiversity value change with elevation when measured through the number of listed habitat types and listed species? Do patterns of spatial coverage and biodiversity concentration coincide, or do they diverge? And can the relationship between average biodiversity richness and total biodiversity volume be understood as a density–volume trade-off?
The logic of the article follows that order. It begins with space, because coverage has to be measured before it can be interpreted. It then turns to biodiversity value, because protected surface alone says too little. The final step is comparative. It asks whether a network that looks mountain-heavy in territorial terms also proves mountain-heavy in ecological terms, and whether that impression holds once one shifts from mean site-level richness to cumulative biodiversity volume. That is where the argument of the paper finally settles: not in the easy question of whether mountains are overprotected or underprotected, but in the harder one of what kind of representation Natura 2000 actually creates along the elevational gradient.
2. Data and Methods
2.1. Study area
The study was conducted at the scale of the European Union and included all 27 current EU member states as a single analytical space. This was not just a convenient frame. Natura 2000 is meaningful here precisely as a continental network, not as a loose sum of national cases. Only at EU scale does its internal spatial logic become visible [2].
For cartographic purposes, the visual frame was restricted to continental Europe. Including overseas and distant island territories linked to EU member states produces a map that is formally complete but analytically awkward: Europe shifts away from the centre, scale becomes uneven, and the mountain systems relevant to the study lose visual clarity. The analytical unit therefore remained the EU, while map visualisation was limited to continental Europe [7].
2.2. Data sources
The analysis relied on four data components. The first was the Natura 2000 polygon dataset, downloaded from the European Environment Agency in the release version end 2024 rev. 01, which provided the site geometries used for all coverage calculations [2]. The second was the Natura 2000 tabular database, also from the EEA and in the corresponding end 2024 rev. 01 release. This dataset contains Standard Data Form information for individual sites and allowed the identification of listed habitat types and species for each SITECODE [6]. The third component was the EU boundary derived from Natural Earth Admin-0 Countries, used to construct the EU study frame and clip the spatial datasets consistently [7]. The fourth was a digital elevation model obtained through the elevatr workflow in R, which made it possible to retrieve elevation data directly for the EU polygon in a reproducible way [8]. All spatial data were transformed to EPSG:3035 (ETRS89-LAEA Europe). This projection was chosen because it is intended for pan-European analysis and preserves area relationships, which is essential in a study built on territorial shares, area-based comparisons, and proportional coverage [9].
2.3. Spatial processing
The spatial workflow was straightforward. Natura 2000 polygons were read from the EEA geodatabase, transformed to EPSG:3035, and clipped to the EU boundary. The digital elevation model was likewise reprojected to EPSG:3035 and cropped to the same extent, creating a common analytical frame for all area calculations.
To assess protection across the elevation gradient, the Natura 2000 polygon layer was rasterised to the DEM grid. This converted the network into a binary surface in which each raster cell recorded either Natura 2000 presence or absence. The logic is simple enough: once protection and elevation are expressed on the same grid, their relationship can be measured directly rather than inferred from partly overlapping vector geometries.
Elevation values were then extracted for Natura 2000 sites using site-level mean elevation rather than centroids. This was important because many sites are irregular, elongated, or topographically heterogeneous. A centroid may easily fall in a locally unrepresentative position, especially in mountain terrain. Mean site elevation is still a simplification, but a more defensible one at EU scale.
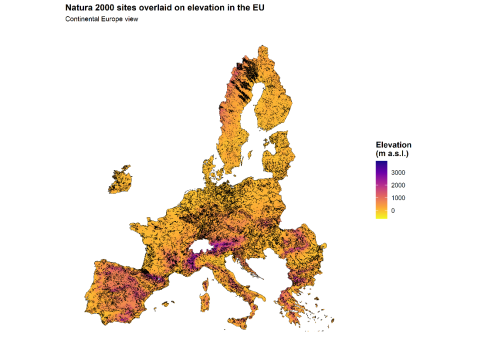
Fig. 1. Map 1. Natura 2000 sites overlaid on elevation in the European Union
2.4. Definition of mountain areas and elevation bands
Mountain areas were defined as land above 1000 m a. s.l. No single threshold is perfect across a continent as varied as Europe, and a mountain in Scandinavia does not begin under exactly the same ecological conditions as a mountain in the Mediterranean. Still, 1000 m provides a workable continental approximation: high enough to separate clearly elevated terrain from most lowland and foothill landscapes, but broad enough to retain a meaningful mountain domain for comparison.
Using this threshold, the study identified a mountain area of 294,158 km² within the analytical frame. This was compared with the total EU analytical area of 4,247,894 km² and the Natura 2000 area of 1,472,321 km². For the gradient-based analysis, elevation was divided into six classes: 0–500 m, 500–1000 m, 1000–1500 m, 1500–2000 m, 2000–3000 m, and >3000 m.
These bands were selected because they are broad enough to remain stable at continental scale and still fine enough to distinguish lowlands, uplands, lower mountain belts, and high mountain terrain. In the final dataset they also proved analytically useful: Natura 2000 coverage rose from 30.3 % in the 0–500 m belt to 81.7 % in the >3000 m class
2.5. Biodiversity metrics
The biodiversity component of the analysis was built directly from the Natura 2000 tabular database. For each site, two quantities were counted: the number of distinct listed habitat types and the number of distinct listed species linked to the site code in the Standard Data Form tables [6]. These were then combined into a single indicator:
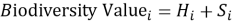
where H i is the number of distinct habitat types listed for site iii, and SiS_iSi is the number of distinct listed species.
This measure is intentionally plain. It does not pretend that one habitat type is equivalent to one species in ecological function, nor that all listed entities contribute equally to conservation value. But that is not really the point here. The aim was to construct a transparent site-level biodiversity indicator that could be reproduced directly from official Natura 2000 records and compared across thousands of sites without introducing opaque weighting decisions too early in the analysis. A second indicator captured biodiversity intensity relative to site size:
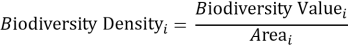
where Area i is the area of site i in square kilometres.
That distinction turned out to be essential. A large site may accumulate many listed features simply because it is large. A much smaller site may be far denser in biodiversity terms. Without separating value from density, the analysis would blur richness and scale together.
2.6. Analytical metrics
Three main spatial metrics were calculated. Overall Natura 2000 coverage across the EU was defined as:
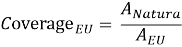
where A Natura is the total Natura 2000 area and A EU is the total analytical area of the EU. Mountain coverage was defined as:
where A mountain∩NaturaA is the mountain area that falls within Natura 2000 and A mountain is the total mountain area above 1000 m. Finally, a Representation Index was used to compare mountain protection with the EU average:
An RI greater than 1 indicates that mountain areas are overrepresented relative to the EU average, whereas an RI below 1 would indicate underrepresentation. In the final results, Coverage EU equalled 34.7 %, Coverage mountain reached 59.5 %, and the resulting RI was 1.72. Those figures belong to the Results section analytically, but it is useful to state them here once because they clarify what the metric actually measures.
2.7. Analytical design
The study followed a stepwise design. It began with spatial representation, asking how much of the EU and how much of the mountain domain are covered by Natura 2000. It then moved to the elevational gradient of protection, tracing how coverage changes from lowland to high-mountain belts. From there the analysis shifted to biodiversity metrics, first at the site level and then by elevation band, using biodiversity value and biodiversity density. The final step compared mean biodiversity richness with total biodiversity volume across elevation classes. That comparison, more than anything else, was meant to test whether the Natura 2000 network reflects a simple mountain bias or a more complicated density–volume trade-off.
3. Results
3.1. Spatial representation of mountain areas
At the broadest territorial scale, Natura 2000 covers 34.7 % of the analytical area of the European Union. Once the focus shifts to land above 1000 m a. s.l., the proportion rises to 59.5 %. The difference is not slight. It produces a Representation Index (RI) of 1.72, which means that mountain areas are represented in the network at roughly 1.7 times the average EU territorial rate. Whatever one may have expected at the outset, mountain land does not sit at the margins of Natura 2000. It is deeply built into it.
The areal contrast gives this pattern more weight. The total analytical area of the EU amounts to 4,247,894 km². Of this, 1,472,321 km² fall within Natura 2000. Mountain terrain accounts for 294,158 km², and 175,145 km² of that mountain area lie within the network. These values make the argument harder to reduce to abstraction. The pattern is not symbolic. It is territorial.
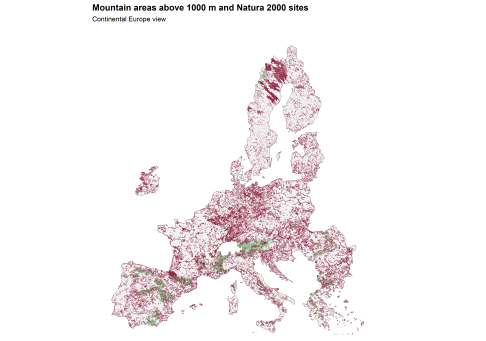
Fig. 2. Map 2. Mountain areas above 1000 m and Natura 2000 sites
Map 2 shows the same result in spatial form. Large parts of the major European mountain systems, above all the Alps, but also other upland and highland belts, overlap strongly with Natura 2000. The network does not merely reach mountain Europe. It holds onto it rather firmly.
3.2. Natura 2000 coverage along the elevation gradient
The same tendency becomes clearer when protection is read by elevation band. Natura 2000 covers 30.3 % of land in the 0–500 m belt, 43.2 % in 500–1000 m, 56.5 % in 1000–1500 m, and 67.8 % in 1500–2000 m. Above that, the pattern remains high: 65.0 % in the 2000–3000 m class and 81.7 % above 3000 m. The overall direction is unmistakable. Protection intensifies with elevation.
The lowland belt is therefore the least protected, while mountain and high-mountain classes are represented far more strongly. There is a slight dip between 1500–2000 m and 2000–3000 m, from 67.8 % to 65.0 %, but the broader gradient remains intact. Once the landscape rises above the lowland and lower upland zone, Natura 2000 coverage stays well above the continental average.
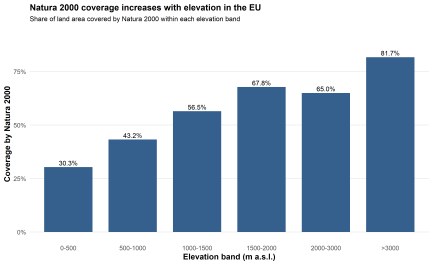
Fig. 3. Natura 2000 coverage across elevation bands in the European Union
The areal background of these percentages matters too. The 0–500 m class occupies 3,224,938 km², by far the largest share of the EU analytical area, whereas the >3000 m class covers only 539 km². High elevations do not dominate European space. They are simply protected at a much higher rate.
3.3. Site-level biodiversity value by elevation
The elevational picture becomes more revealing once site-level biodiversity is added. Mean biodiversity value per Natura 2000 site, defined as the sum of listed habitat types and listed species, rises from 15.3 in the 0–500 m class to 19.2 in 500–1000 m, 25.1 in 1000–1500 m, and 27.4 in 1500–2000 m. The highest mean value is recorded in the 2000–3000 m band, where it reaches 31.2. Above 3000 m, the value drops to 4.0, though this class contains only one site and is not structurally comparable to the others. That increase is not trivial. Between the lowest band and the 2000–3000 m class, mean biodiversity value more than doubles. The elevational gradient is therefore not confined to territorial coverage. It is reflected, quite clearly, in the biodiversity content of Natura 2000 sites themselves.
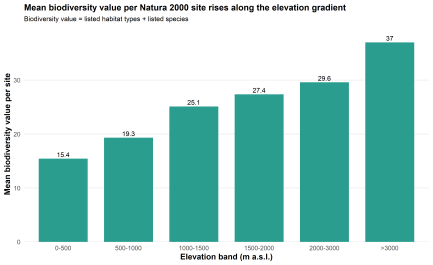
Fig. 4. Mean biodiversity value per Natura 2000 site across elevation bands
The same pattern appears when habitat and species components are considered separately. Mean habitat richness rises from 4.99 in the 0–500 m class to 14.6 in the 2000–3000 m class, while mean species richness increases from 10.3 to 16.6. Habitat richness rises more sharply, but both components move in the same general direction.
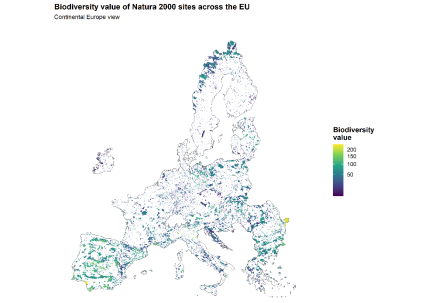
Fig. 5. Map 3. Biodiversity value of Natura 2000 sites across the EU
Map 3 gives that gradient a territorial shape. Biodiversity-rich Natura 2000 sites are not scattered at random. Their strongest concentrations align with the major mountain systems, especially the Alps and other elevated belts of Central and Southern Europe. At the same time, the map does not reduce biodiversity value to mountains alone. It also shows a broad lowland background of numerous sites with more moderate individual values. Figure 4 gives the gradient; Map 3 shows where it lives.
Biodiversity density complicates the picture, and usefully so. Mean density is highest in the lower classes: 840.0 in the 0–500 m belt, 56.0 in 500–1000 m, 41.3 in 1000–1500 m, 33.7 in 1500–2000 m, and 3.38 in 2000–3000 m. At first this seems at odds with the rise in mean biodiversity value. It is not. Lowland values reflect many small sites with relatively high biodiversity content per square kilometre, whereas high-elevation sites are often much larger. Their biodiversity value is high in absolute and mean site terms, but once divided by area, density falls.
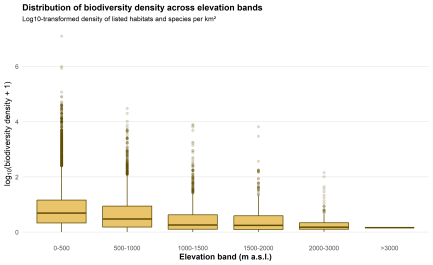
Fig. 6. Distribution of biodiversity density across elevation bands
Figure 6 also shows strong internal variability. Lowland and upland classes contain a much wider spread of density values, while higher bands are more compressed, though based on fewer sites. Natura 2000 sites within the same elevation class do not behave uniformly. Some are sharply concentrated biodiversity units; others are more diffuse.
3.4. Total biodiversity volume across elevation bands
The most important turn appears when biodiversity is aggregated rather than averaged. Once total biodiversity value is summed across all Natura 2000 sites in each elevation band, the pattern shifts downward. The 0–500 m class contributes 312,763, by far the highest cumulative biodiversity value in the study. The 500–1000 m band follows with 69,087, then 26,420 in 1000–1500 m, 10,038 in 1500–2000 m, and 5,992 in 2000–3000 m. The >3000 m class contributes only 4, again reflecting the presence of a single site.
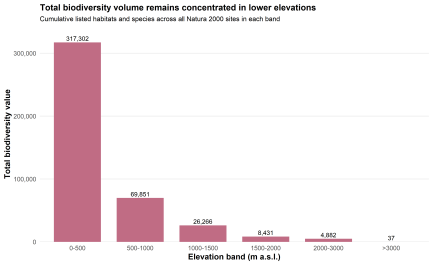
Fig. 7. Total biodiversity value by elevation band
This is where the structure of the network becomes more interesting than a simple mountain–lowland contrast. High-elevation sites are richer on average, yes. But lowlands hold far more total biodiversity value because they contain far more Natura 2000 sites. The 0–500 m band alone includes 20,457 sites, compared with 192 in the 2000–3000 m class. Lowlands therefore dominate not in site-level richness, but in cumulative biodiversity volume.
Taken together, the results show a clear duality. Protection intensity rises with elevation. Mean biodiversity value per site rises with elevation too. Yet the largest cumulative biodiversity load remains concentrated in lowland belts, above all below 500 m. The mountains are strongly represented, and they are biodiversity-rich. Lowlands, by force of number, still hold the larger aggregate share. That is the empirical shape of the density–volume trade-off.
4. Discussion
1.1. Mountains are not underrepresented in Natura 2000
The first conclusion is simple, and it matters precisely because it runs against the initial suspicion of the study. Mountain areas are not spatially underrepresented in Natura 2000. The network covers 34.7 % of the EU analytical area overall, but 59.5 % of land above 1000 m a. s.l., which yields a Representation Index of 1.72. This is too large a gap to dismiss as technical noise. In territorial terms, mountain land is clearly overrepresented.
That still does not mean that every mountain system or every mountain habitat is equally well protected. Spatial overrepresentation is not the same thing as ecological completeness. A protected-area network may concentrate strongly in one broad territorial domain and still leave parts of that domain unevenly covered. But the result remains clear: at continental scale, Natura 2000 is more concentrated in mountain terrain than in the EU surface on average.
There is an obvious objection here. Protected areas are often established where economic pressure is lower, agricultural value is weaker, and political resistance is smaller. In that sense, mountain overrepresentation can be read partly as a residual pattern shaped by feasibility rather than by pure ecological optimisation [10; 11]. That argument should not be dismissed. Mountains are indeed steeper, less accessible, and often less intensively transformed than lowlands. Still, the results suggest that this explanation is only part of the story.
4.2. Protection and biodiversity show a common elevational trend
What complicates the residual-protection argument is that spatial protection does not rise alone. Mean site-level biodiversity value also increases with elevation. Natura 2000 coverage rises from 30.3 % in the 0–500 m class to 43.2 % in 500–1000 m, 56.5 % in 1000–1500 m, 67.8 % in 1500–2000 m, 65.0 % in 2000–3000 m, and 81.7 % above 3000 m. Mean biodiversity value per site follows the same broad direction, increasing from 15.3 in lowlands to 19.2, 25.1, 27.4, and finally 31.2 in the 2000–3000 m band. Mean habitat richness rises from 4.99 to 14.6, while mean species richness increases from 10.3 to 16.6.
This parallel movement matters. If mountain overrepresentation were only the by-product of low economic competition, one might expect biodiversity value to stay flat or even weaken as coverage rises. That is not what appears here. Higher protection intensity and higher site-level biodiversity value broadly coincide. Natura 2000 is not just concentrated in elevated terrain; that terrain is also richer in listed habitats and species. This does not prove deliberate optimisation along elevation bands, but it does weaken the simplest version of the “protected by default” interpretation.
4.3. Density–volume trade-off
This is where the core argument of the article settles. If the analysis stopped at mean values, the story would be almost too neat: high-elevation Natura 2000 sites are richer, and mountain belts are more strongly protected. But once biodiversity is summed rather than averaged, the pattern bends.
The 0–500 m class carries the highest cumulative biodiversity value in the study, 312,763, followed by 69,087 in 500–1000 m. By contrast, the 2000–3000 m class, despite having the highest mean biodiversity value per site (31.2), contributes only 5,992 in total. The reason is straightforward. Lowlands contain far more Natura 2000 sites: 20,457 in the 0–500 m class, against 192 in the 2000–3000 m band. Lowlands therefore dominate not in richness per site, but in cumulative biodiversity volume.
That is the density–volume trade-off. High-elevation sites are richer on average and sit in parts of the network with stronger territorial protection. Lowland belts, by force of number, hold the largest aggregate biodiversity burden. This changes how representation has to be understood. It is no longer enough to ask whether biodiversity rises or falls with elevation. It does rise in mean site-level terms. The more difficult question is which form of representation matters most for interpretation: biodiversity density or biodiversity volume.
The distinction is not semantic. A conservation system that strongly protects biodiversity-dense mountain sites may still depend heavily on lower-elevation landscapes for the cumulative maintenance of listed habitats and species. Mountains and lowlands are not competing versions of the same ecological role. They anchor different parts of the network’s conservation logic.
4.4. Implications for conservation planning
The results should not be read as an argument for reducing attention to mountains simply because they are already overrepresented. That would be a poor conclusion. Mountain systems remain ecologically distinctive, climatically sensitive, and disproportionately rich at the site level. The strong signal observed here confirms that mountains occupy an important place within the Natura 2000 network [1; 2]. But the findings do not support a mountain-exclusive conservation vision either. The rise in mean biodiversity value across the 1500–3000 m belts does not mean that the central biodiversity priorities of Natura 2000 lie there alone. The 0–500 m class still contains the largest cumulative biodiversity value simply because that is where the network is numerically densest. Treating lowlands as secondary because they are less visually dramatic would be ecologically careless.
The planning lesson is therefore a real balance, not a polite abstraction: a balance between high-density mountain systems and high-volume lowland systems. Mountains matter because their sites are rich, concentrated, and likely to become even more exposed under climate change [1; 2]. Lowlands matter because they contain such a large share of the network’s total biodiversity load. Natura 2000 can only be interpreted properly if both dimensions are kept in view.
4.5. Limitations
few limitations should be stated plainly. Site-level biodiversity value here is based on listed habitats and listed species in the Natura 2000 tabular database, not on full ecological inventories. It reflects official conservation content rather than total biodiversity actually present on each site [2; 6]. The measure is therefore robust for comparative analysis within Natura 2000, but it should not be mistaken for a complete biodiversity census.
The elevation model is also relatively coarse compared with the local complexity of mountain terrain. At EU scale this is acceptable, though it inevitably smooths sharp topographic transitions. The 1000 m a. s.l. threshold is another simplification. It works reasonably well for continental comparison, but mountainness does not begin at exactly the same altitude across Scandinavia, the Alps, the Carpathians, and Mediterranean ranges. A different threshold would shift the exact totals, even if the broader pattern would likely remain similar.
Even so, the central result is stable enough to hold: mountain areas are spatially overrepresented in Natura 2000, mean biodiversity value per site rises with elevation, and total biodiversity volume remains concentrated in lowland belts.
5. Conclusion
This study began with a deceptively simple question: are mountain areas insufficiently represented in Natura 2000, or does the network in fact lean toward them? At the scale of the European Union, the answer is clear. Mountain territories are not underrepresented in spatial terms. Natura 2000 covers 34.7 % of the EU analytical area overall, but 59.5 % of land above 1000 m a. s.l., producing a Representation Index of 1.72.
The elevational gradient reinforces that result. Protection rises from 30.3 % in the 0–500 m belt to 43.2 % in 500–1000 m, 56.5 % in 1000–1500 m, 67.8 % in 1500–2000 m, 65.0 % in 2000–3000 m, and 81.7 % above 3000 m. Mean site-level biodiversity value follows the same broad pattern, increasing from 15.3 in lowlands to 31.2 in the 2000–3000 m class. High-elevation sites are therefore not only more strongly protected; they are also richer in terms of recorded Natura 2000 conservation content.
And yet the article does not end there. Once biodiversity is aggregated rather than averaged, the picture shifts. The 0–500 m class contributes a cumulative biodiversity value of 312,763, whereas the 2000–3000 m band contributes 5,992. Lowlands contain far more Natura 2000 sites — 20,457 against 192 — and for that reason they hold the largest total biodiversity volume even while their average site-level biodiversity value remains lower.
This is the central result of the paper. Natura 2000 does not display a simple elevational bias. It reflects a density–volume trade-off. Mountain sites are more strongly protected and, on average, more biodiversity-rich. Lowland belts remain cumulatively indispensable because they carry the largest overall biodiversity load of the network. A conservation strategy focused only on biodiversity-dense mountain systems would miss the cumulative significance of lowlands; one focused only on aggregate volume would flatten the distinct ecological value of high-elevation sites. Natura 2000, as these results suggest, has to be read through both lenses at once.
References:
- European Commission. Managing and protecting Natura 2000 sites [Electronic resource]. Available at: https://environment.ec.europa.eu/topics/nature-and-biodiversity/natura-2000/managing-and-protecting-natura-2000-sites_en (accessed 24 April 2026).
- European Environment Agency. Natura 2000 data — the European network of protected sites [Electronic resource]. Available at: https://www.eea.europa.eu/data-and-maps/data/natura-14 (accessed 24 April 2026).
- Payne D., Spehn E. M., Snethlage M. A., Fischer M. Opportunities for research on mountain biodiversity under global change // Current Opinion in Environmental Sustainability. 2017. Vol. 29. P. 40–47.
- Payne D., Spehn E. M., Prescott G. W., Geschke J., Snethlage M. A., Fischer M. Mountain Biodiversity Is Central to Sustainable Development in Mountains and Beyond // One Earth. 2020. Vol. 3. No. 5. P. 530–533.
- Richter T., Dirnböck T., Menzel A. et al. Effects of climate and forest development on habitat specialization and biodiversity in Central European Mountain forests // Communications Biology. 2024. Vol. 7.
- European Environment Agency. Natura 2000 tabular dataset — version end 2024 rev. 01 [Electronic resource]. Available at: https://www.eea.europa.eu/en/datahub/datahubitem-view/6fc8ad2d-195d-40f4-bdec-576e7d1268e4 (accessed 24 April 2026).
- Natural Earth. Admin 0 — Countries [Electronic resource]. Available at: https://www.naturalearthdata.com/downloads/10m-cultural-vectors/10m-admin-0-countries/ (accessed 24 April 2026).
- Hollister J., Shah T., Robitaille A. L. elevatr: Access Elevation Data from Various APIs [Electronic resource]. CRAN package. Available at: https://cran.r-project.org/package=elevatr (accessed 24 April 2026).
- INSPIRE Registry. ETRS89-LAEA Europe (EPSG:3035) [Electronic resource]. Available at: https://inspire.ec.europa.eu/crs/3035 (accessed 24 April 2026).
- Venter O., Magrach A., Outram N., Klein C. J., Di Marco M., Watson J. E. M. Bias in protected-area location and its effects on long-term aspirations of biodiversity conventions // Conservation Biology. 2018. Vol. 32. No. 1. P. 127–134.
- Joppa L. N., Pfaff A. High and far: Biases in the location of protected areas // PLoS ONE. 2009. Vol. 4. No. 12. e8273.

