


The purpose of this study aims to analyze the impact of slope on vehicle emissions at the signalized intersection.
Key words: road intersection, emission factors, road slope, emission model
With the development of economy and the improvement of people's living standard, the output and quantity of vehicles are increasing rapidly. The sustained and rapid increase in the number of vehicles in cities has brought serious challenges to urban environmental pollution. Vehicle emission pollution, especially particle size of small particles on the human body caused great damage, the existence of the potential threat of photochemical smog, a direct impact on people's health [1].
The control of vehicle exhaust emission is the key problem for the government and the people. Therefore all countries are taking active measures for vehicle pollution, in addition to actively support the development of new energy vehicles, on the one hand, through the development of increasingly stringent emission regulations, vehicle emission standards; on the other hand, the establishment of vehicle pollution control system, the formation of technology and management of a series of complete matching system [2].
In recent years, the research of vehicle exhaust emission has been increasing, which is of great significance to the improvement of air pollution and the sustainable development of ecological environment. Despite significant efforts to improve traffic emission models, limited attempts have been made to include the road gradient effect on light vehicles emissions. This study aims to analyze the impact of slope on vehicle emissions at the signalized intersection.
Highway is an important infrastructure of national economy and social development. At the same time, the construction and operation of highway has brought about the problem of air pollution. As the vehicle continues to increase, resulting in congestion, emissions increased. In spite of the lack of long-term funding, the strategy to build capacity and reduce traffic congestion has not stopped [3]. At present, in the process of highway planning to be completed and put into operation, the control of the environment is mainly through the feedback and improvement of environmental assessment. In the process of highway planning and preliminary design, it is necessary to carry on the forecast and evaluation of the atmospheric environmental impact of the road. After the completion of the operation, it is necessary to carry out the atmospheric environmental evaluation, which is convenient to put forward the improvement measures [4]. However, these evaluations are based on the total amount of moving source emission inventory, which is based on the velocity dependent vehicle emission factors. In fact, the factors that affect the vehicle emission factors in addition to the vehicle speed, but also relate to the geometric design of pavement parameters (such as road slope, horizontal curve, vertical curve, etc.). At present, highway design standards or guidelines have not considered the influence of geometric alignment design on vehicle emissions. In geometric design, slope is the most common linear [5].
Assuming that the vehicle traveling on the slope of the appropriate value of the road, the number of start should be relatively few; if the slope value is not appropriate, causing frequent start of vehicles, that the vehicle emissions will increase. Therefore, there should be a relationship between road gradient and vehicle emissions.
Experimental data and analysis
In order to achieve the goal of the study, a variety of research methods are used in this paper. First, VISSIM traffic simulation software is used in the establishment of micro model of single signalized intersection. And collection the speed and acceleration of each car per second at the intersection of the entrance lane group.
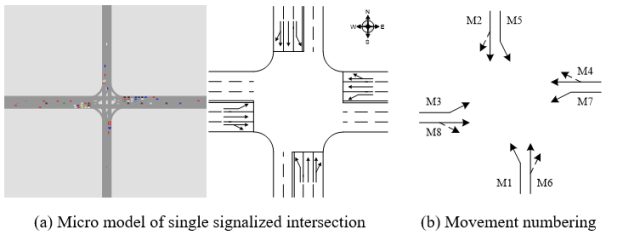
Fig.1. Layout and movement numbering
Secondly, the Vehicle specific power (VSP) method is used to calculate the average emission factors of the green lights and red lights in each lane.
Vehicle specific power is a mathematical representation of engine load against aerodynamic drag, acceleration, rolling resistance, plus the kinetic and potential energies of the vehicle, all divided by the mass of the vehicle. In practice, a generic set of coefficients values estimating VSP for a typical light duty fleet is applied as a useful basis for characterization [6].
![]() (1)
(1)
Where:
v — vehicle speed (m/s);
a — vehicle acceleration/deceleration rate (m/s2);
ϴ — road grade in meters elevation change per meter of road distance (radians).
Many studies have shown that the emission factors of pollutants in vehicle exhaust are more dependent on motor vehicle specific power than speed and acceleration. After a lot of measurement and statistics, the VSP zoning of the car and the emission factors of three kinds of pollutants such as CO, HC and NOx, shown in Table 1.
Table 1
Specific power divisions and VSP-based emission factors of some common pollutants for cars
|
Partition |
Specific power (kW/t) |
Pollutant emission factor (mg/s/pcu) |
||
|
CO |
HC |
NOx |
||
|
1 |
VSP≤-10 |
1.9025 |
0.0673 |
0.3437 |
|
2 |
-10≤VSP<-2 |
2.0918 |
0.1030 |
0.5046 |
|
3 |
-2≤VSP<0 |
2.5419 |
0.1593 |
0.5562 |
|
4 |
0≤VSP<2 |
1.8237 |
0.2323 |
0.5855 |
|
5 |
2≤VSP<5 |
2.3533 |
0.1896 |
0.6916 |
|
6 |
5≤VSP<9 |
2.2451 |
0.2592 |
0.8216 |
|
7 |
9≤VSP<13 |
2.6964 |
0.3180 |
1.0906 |
|
8 |
13≤VSP<17 |
4.0725 |
0.4383 |
1.1764 |
|
9 |
17≤VSP<20 |
3.9979 |
0.5472 |
1.3588 |
|
10 |
20≤VSP |
4.5135 |
0.5174 |
1.4514 |
MATLAB software is used to process and analyze the data, and calculate the emission factors, and the vehicle emission. Results of the calculation the emission factors and the vehicle emissions are shown in Table 2 and in Figure 2.
Table 2
The calculation of the emission factors and the vehicle emissions for each line
|
Gradient % |
Movements |
Vehicles |
Emission factors (mg/s/pcu) |
Vehicle emissions (mg/s/pcu) |
||||
|
CO |
HC |
NOx |
CO |
HC |
NOx |
|||
|
0 |
1 |
9157 |
1,978452 |
0,232198 |
0,612991 |
18116,69 |
2126,236 |
5613,16 |
|
0 |
2 |
22356 |
1,989256 |
0,234543 |
0,618621 |
44471,81 |
5243,437 |
13829,9 |
|
0 |
3 |
13438 |
2,025708 |
0,238819 |
0,630665 |
27221,46 |
3209,254 |
8474,877 |
|
+1 |
13470 |
2,236381 |
0,275049 |
0,719615 |
30124,05 |
3704,909 |
9693,218 |
|
|
+2 |
13535 |
2,262967 |
0,277828 |
0,72761 |
30629,26 |
3760,405 |
9848,204 |
|
|
+3 |
13552 |
2,263168 |
0,278074 |
0,727745 |
30670,46 |
3768,456 |
9862,407 |
|
|
+4 |
13262 |
2,277787 |
0,279563 |
0,732339 |
30208,01 |
3707,571 |
9712,286 |
|
|
+5 |
14164 |
2,267728 |
0,278425 |
0,729326 |
32120,11 |
3943,617 |
10330,18 |
|
|
0 |
4 |
23985 |
2,009924 |
0,236274 |
0,624572 |
48208,02 |
5667,023 |
14980,35 |
|
-1 |
23862 |
1,846062 |
0,202294 |
0,544018 |
44050,73 |
4827,141 |
12981,35 |
|
|
-2 |
23111 |
1,84527 |
0,201846 |
0,543044 |
42646,05 |
4664,861 |
12550,28 |
|
|
-3 |
22956 |
1,845115 |
0,20165 |
0,542812 |
42356,45 |
4629,087 |
12460,8 |
|
|
-4 |
24063 |
1,845236 |
0,201844 |
0,54307 |
44401,92 |
4856,965 |
13067,9 |
|
|
-5 |
23124 |
1,844598 |
0,20176 |
0,542836 |
42654,49 |
4665,508 |
12552,55 |
|
|
0 |
5 |
11528 |
1,998689 |
0,235842 |
0,622222 |
23040,89 |
2718,791 |
7172,973 |
|
0 |
6 |
27250 |
2,006978 |
0,23758 |
0,62577 |
54690,15 |
6474,06 |
17052,24 |
|
0 |
7 |
13042 |
2,025712 |
0,239935 |
0,632175 |
26419,33 |
3129,228 |
8244,825 |
|
-1 |
12872 |
1,844259 |
0,203553 |
0,545347 |
23739,3 |
2620,14 |
7019,703 |
|
|
-2 |
13277 |
1,843203 |
0,203123 |
0,544696 |
24472,21 |
2696,863 |
7231,932 |
|
|
-3 |
13584 |
1,843628 |
0,203424 |
0,545147 |
25043,84 |
2763,312 |
7405,277 |
|
|
-4 |
12868 |
1,844252 |
0,20231 |
0,543602 |
23731,83 |
2603,325 |
6995,072 |
|
|
-5 |
13246 |
1,843258 |
0,203204 |
0,544713 |
24415,8 |
2691,643 |
7215,274 |
|
|
0 |
8 |
25715 |
2,008523 |
0,236708 |
0,625025 |
51649,18 |
6086,941 |
16072,52 |
|
+1 |
27292 |
2,204567 |
0,271906 |
0,710025 |
60167,06 |
7420,867 |
19378,01 |
|
|
+2 |
26744 |
2,248887 |
0,276409 |
0,723525 |
60144,24 |
7392,295 |
19349,96 |
|
|
+3 |
26148 |
2,258945 |
0,277429 |
0,726464 |
59066,9 |
7254,219 |
18995,57 |
|
|
+4 |
27233 |
2,256521 |
0,277253 |
0,725777 |
61451,84 |
7550,43 |
19765,08 |
|
|
+5 |
26348 |
2,267623 |
0,278363 |
0,729252 |
59747,33 |
7334,295 |
19214,32 |
|
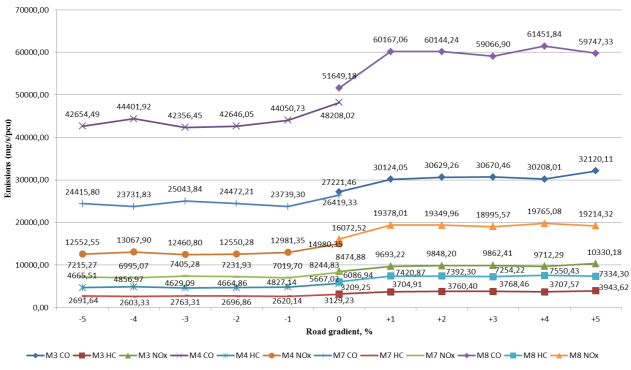
Fig. 2. The influence of the road gradient on vehicle emissions
The above results show that road slope has a certain influence on vehicle emission. When the road slope increases, the vehicle emission factor also increases (M3, M8). When the road slope is reduced, the emission factor of motor vehicles is also reduced (M4, M7).
Conclusion
The main findings show up the relationship between the road gradient and vehicle emissions. Thus, road gradient has a certain influence on vehicle emission factors. Thus, in the process of highway planning and preliminary design, it is also necessary to take into account the road gradient, which can reduce the vehicle emissions. Further study of the impact of road gradient on vehicle emissions is needed, to find the optimal interval slope which will seek to minimize vehicle emissions.
References:
- Wong C K and Wong S C. (2003). Lane-based optimization of signal timings for isolated junctions [J]. Transportation Research Part B. Methodological, 37, 63–84.
- Zhao J,Liu Y and Yang X.(2015). Operation of signalized diamond interchanges with frontage roads using dynamic reversible lane control. Transportation research part C. emerging technologies, 51, 196–209.
- Li X,Chen J and Wang H. (2013). Study on Flow Direction Changing Method of Reversible Lanes on Urban Arterial Roadways in China. Procedia-Social and Behavioral Sciences, 96, 807–816.
- Columbus A. (2012). Perceived costs and benefits of reversible lanes in Phoenix. Institute of Transportation Engineers, ITE Journal, 82, 38–42.
- Ding J, Zhou H and Yao R. (2014). Optimization of Lane Use and Signal Timing for Isolated Signalized Intersections with Variable Lanes. Safe, Smart, and Sustainable Multimodal Transportation Systems, ASCE, 2012–2024.
- He S. and Wang W. and Zhang J. (2013). An Improved Optimization Method for Isolated Signalized Intersection Based on the Temporal and Spatial Resources Integration [J]. Procedia-Social and Behavioral Sciences, 96, 1696–1706.
