


Dynamics of immigration to the US and to Russia: a comparison

Автор: Чайка Дина
Рубрика: 8. Мировая экономика
Опубликовано в
Дата публикации: 04.01.2020
Статья просмотрена: 9 раз
Библиографическое описание:
Чайка, Дина. Dynamics of immigration to the US and to Russia: a comparison / Дина Чайка. — Текст : непосредственный // Проблемы и перспективы экономики и управления : материалы VIII Междунар. науч. конф. (г. Санкт-Петербург, январь 2020 г.). — Санкт-Петербург : Свое издательство, 2020. — С. 7-13. — URL: https://moluch.ru/conf/econ/archive/355/15575/ (дата обращения: 14.05.2024).
The paper analyzes differences and similarities in the dynamics of immigration to the U. S. and Russia. The main focus of the paper are immigration trends in both countries in the contemporary period of 1992–2017.
Between 1992 and 2017 the U. S. foreign-born population increased from 7.9 % to 13.7 % of the total population. In 2017 of 44.5 million immigrants 33.5 million were legal (76.3 % of the total) and estimated 11 million were undocumented or illegal immigrants (23.7 % of the total) [4; 8].
Multiple sources state that Russia now takes the second place after the U. S. in terms of the number of immigrants residing in the country. In 2017 there were 11.3 million of immigrants in Russia, which is 7.8 % of the total population. Among them 8.7 million of immigrants were legal (67 % of all immigrants), and about 2.6 million were considered illegal (33 % of all immigrants) [8].
1. Overview of immigration to theU.S.
In 1990, President George H. W. Bush signed the new comprehensive Immigration Act. This act was an expanded and modified version of the Immigration Act of 1965. It provided a broad range of immigration visas, including family-based visas, employment visas, and a diversity visa lottery program that let 55000 people from “low admittance countries” immigrate annually to the U. S. [15]. The 1990 Immigration Act initiated the H-1B visa program that enabled U. S. employers to sponsor up to 65000 professional workers per year. The number of international students enrolled in U. S. institutions was also increased substantially. While only 48,486 international students were enrolled in U. S. colleges and universities in 1960, their number climbed to 819,644 in 2012 [15]. The law also created the EB-5 visa, which provided a pathway to a green card for foreign investors who invested at least $1 million in a business in the US that employed a minimum of 10 American workers.” [15].
The Immigration Act of 1990 boosted legal immigration in 1992 to 973,977 Legal Permanent Residents (LPR) per year. In the following years, however, the number of legal immigrants arriving to the US decreased (to 720,461 in 1995, see Figure 1 and Table 1). This decrease can be associated with the resurgence of anti-immigrant feeling, in particular among lower-income Americans competing for jobs with immigrants willing to work for lower wages [4].
In 1996 the US Congress passed the Immigration Reform and Immigrant Responsibility Act, which strengthened border protection and limited the use of welfare programs by immigrants [6]. As a consequence of these new regulations, the number of legal immigrants coming to the U. S. decreased and stayed below one million until 2001 (see Figure 1 and Table 1). In 2001 it for the first time surpassed one million reaching 1,064,318. The influx of new immigrants consisted primarily from immigrants from Asian countries, eclipsing the number of immigrants from the traditional source of Latin America.
After the terrorist attacks on September 11, 2001 the US immigration enforcement was strengthened again and, as a consequence, the number of immigrants arriving in the U. S. dropped to 705,827 in 2003. Yet by 2005 this number again surpassed one million, which could be explained by the booming U. S. economy and contracting Mexico’s economy [11]. From 2005 to 2017 the number of legal immigrants arriving in the US was held almost constant and did not drop below one million per year (see Figure 1 and Table 1).
Beginning with 2017, the administration of the newly elected president Trump started to introduce policy changes aimed to reduce immigration. These changes included building “the wall” across the U. S. — Mexico border, banning nationals of select Moslem countries from entering the U. S., and reducing the quota for refugee admissions. The new policy is primarily aimed at cutting
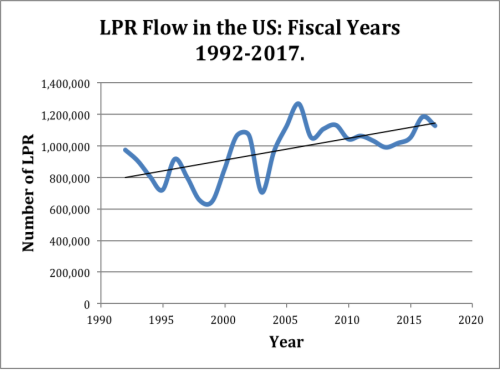
Fig.1. Source: [8]
![]() illegal immigration, which was dropping even before President Trump announced his campaign. A study, published by the Pew Research Center, put the number of undocumented immigrants in the United States at 10.7 million in 2016, down from a peak of 12.2 million in 2007 [3].
illegal immigration, which was dropping even before President Trump announced his campaign. A study, published by the Pew Research Center, put the number of undocumented immigrants in the United States at 10.7 million in 2016, down from a peak of 12.2 million in 2007 [3].
President Trump policies implemented in 2017–18 also reduced legal immigration by “adding hurdles and increasing scrutiny in the employment-visa application process, making it harder for businesses to hire foreign workers.” [8].
Table 1
Immigrant Statistics in the U. S., select years Source: [8]
|
Status of Immigrants |
Years |
|||||
|
1992 |
1995 |
2000 |
2003 |
2005 |
2017 |
|
|
LPR |
973,977 |
915,900 |
849,807 |
705,827 |
1,122,257 |
1,127,167 |
|
Refugees |
115,330 |
78,936 |
66,546 |
25,329 |
53,813 |
53,691 |
|
Asylees |
3,961 |
17,374 |
22,859 |
15,470 |
25,257 |
26,568 |
|
Naturalized |
240,252 |
488,088 |
888,788 |
462,435 |
604,280 |
707,265 |
2. Overview of Immigration to Russia
While the scale of immigration to Russia in 1992–2017 is comparable to that of the US, the origin of Russian immigration during this period was different. Unlike the US most of immigrants to Russia came from countries that were a part of one country — the USSR, which Russia was also a part of. But when the USSR broke apart in 1991, people who came to Russia from any other republic that was previously a part of the USSR became immigrants.
The immigrants naturalizing process in Russia was regulated by the Federal Law of November 28th, 1991 № 1948-I “On the citizenship of the Russian Federation”. This law enabled a relatively easy process of naturalizing for immigrants. Thus, section 13 states that “any person, no matter where they were born, is considered a citizen of the Russian Federation if at least one of their parents at the moment of the person’s birth was a citizen of the USSR and was residing on the territory of the Russian Federation.” Section 18 states that “citizens of the USSR that were residing in a country that was a part of the USSR and came to the Russian Federation for residence after February 6, 1992 and claim their willingness to become a citizen of the Russian Federation, obtain the citizenship of the Russian Federation” [1]. Until 2007 the major part of immigrants was those coming from the countries that were previously included in the USSR: 80 % of immigrants in Russia were Russian in terms of ethnicity, as reflected in their USSR passports [14].
The main incentive for ex-USSR citizens to move to Russia was economic crisis, deeper in most other republics than in Russia. “The transformational recession of the 1990s and a sharp increase in income inequality have brought about massive poverty and deprivation in the region. The extremes of poverty and inequality were reached in countries of the former USSR — countries with the longest history of egalitarian communist economy” [9].
By the end of 1992, the number of legal immigrants in Russia was 926,020. It has reached 1,191,355 people in 1994 (See Figure 2 and Table 2). In the following years, however, the number of immigrants annually arriving in Russia started to decrease due to deepening economic crisis and stricter limits set for immigration in 2001. The transformational recession and stricter immigration control caused the number of immigrants arriving to Russia to fall to 119,157 in 2004.
From 2005 the number of immigrants started to increase again (See Figure 2 and Table 2). This increase occurred due to the macroeconomic recovery and to the change in the rules of accounting for immigrants. Starting in 2007 foreign-born people that acquired the permission for the permanent residence for the first time were now counted as immigrants [13]. From 2011 people who are registered at temporary places of residence in Russia for a period of at least 9 months were also counted as immigrants. In the following years, from 2011 to 2017 the registered annual immigrant inflow increased to 589 thousand.
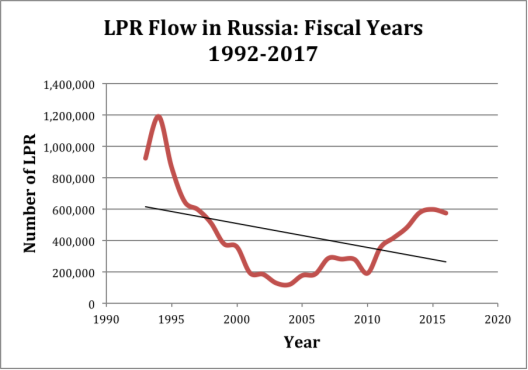
Fig. 2. Source: [12]
Table 2
Immigrant Statistics in Russia by Years Source: [12]
|
Status of Immigrants |
Years |
|||||
|
1992 |
1994 |
2004 |
2009 |
2010 |
2017 |
|
|
LPR |
926020 |
119135 |
119157 |
279907 |
191656 |
589000 |
|
Refugees |
- |
- |
8725 |
223 |
779 |
598 |
|
Asylees |
- |
- |
1202 |
3338 |
3425 |
228392 |
|
Naturalized |
- |
- |
- |
- |
- |
257822 |
3. Comparing immigration in the US and Russia
The level of annual legal immigration flow to the US during the studied period fluctuated around one million people a year. In Russia it fluctuated at less than half that level (370 thousand). Overall the legal immigration flow to the U. S. has a positive trend throughout the whole period up until 2017. In Russia the overall trend of immigration was decreasing with much wider fluctuations. Here a sharp increase in the number of immigrants in 1992–94 was followed by a no less sharp decrease in 1994–2004. This could be explained, as mentioned above, by the fact that when the USSR broke apart in 1991, all USSR citizens who came to Russia from other republics automatically became immigrants. This is what made the dynamics of immigration to Russia increase rapidly at the beginning of the period and decline again, when the policies of assigning citizenship were revised.
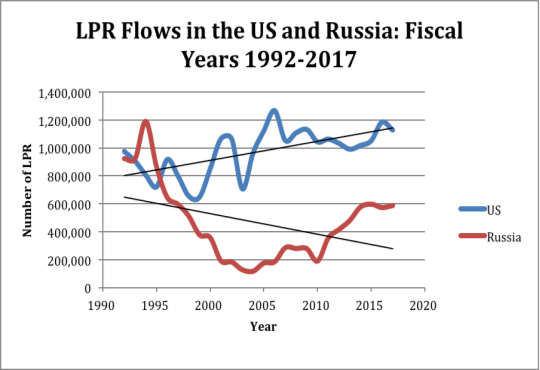
Fig. 3. Source: [8]
An important indicator of immigrant flows is the net migration rate.
An important indicator of the dynamics of immigrant flows is the net migration rate calculated using the formula:
n = [(I-E)/P] x 1000,
where I — annual immigration per year, E — annual emigration per year, P — population of the country at the end of the year.
In the US the net migration rate fluctuated around 3.5 with a slight increase from 1992 to 2008. In the period of 2008–2009 the net migration rate rapidly increased from 2.92 to 4.25 (see Figure 4). Afterwards, in 2009–2014 it was constantly decreasing, particularly fast in 2013–2014. But from 2014 to 2017 it was increasing again going up to 3.9 in 2017 [1, 2]. Throughout the whole period from 1992 to 2017 the US net migration rate stayed over 2.5 within the bounds of no more than 1.9 [5], which confirms attractiveness of the US as an “immigrant magnet country”.
In Russia the net migration rate level was generally much lower than in the US. Between 2000 and 2006 it was quite constant at about 1, but in the period of 2006–2007 it rapidly dropped to 0.29 and stayed low until 2012 when it rapidly and increased to 1.8 in 2013 (see Figure 4). From 2013 to 2017, the migration rate stabilized again at the level of about 1.7 [5]. On average the net migration rate level in Russia was three times lower than in the US.
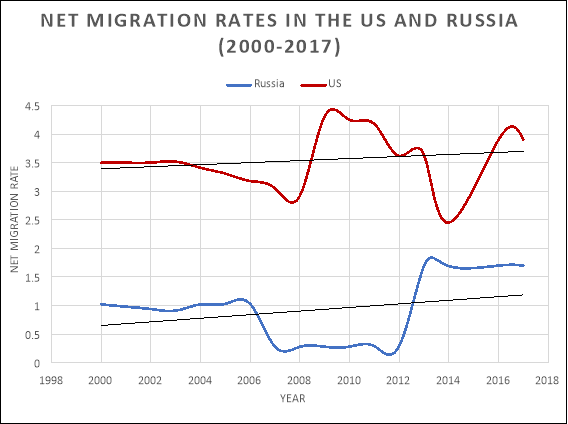
Fig. 4. Source: [5]
4. Conclusion
Overall during most of the period of study the dynamics of legal immigration to the U. S. had an increasing trend with about one million immigrants legally entering the country. In Russia during the same period legal immigration proceeded at less than half of that level and had a downward trend. The major fluctuations in immigration to Russia were driven primarily by changes in economic situation in the countries of the former USSR and by modifications in rules of accounting for immigrant population.
During the studied period both countries experienced immigration inflow surpassing emigration outflow. However in the US the rate of net immigration was on average about three times higher than in Russia. Future trends in immigration in the US can change due to the policy of stricter immigration enforcement adopted by President Trump’s administration. Immigration to Russia will continue to be determined by economic situation in the countries of the former USSR.
References:
- Act of the Russian Federation “On the Citizenhip of the Russian Federation” [O Grazhdanstve Rossiiskoi Federatsii]. Ch. 2, art. 12. Russian Federation. Available at: http://www.democracy.ru/library/laws/federal/1948-I_fz/page2.html
- Child Trends. (2018). Immigrant Children. Available at: https://www.childtrends.org/indicators/immigrant-children.
- Chadha, J. & Gee, K. (2018). U. S. Workers Only: Companies Hesitate to Hire Foreign M. B. A. Students. The WallStreet Journal.
- Chishti M., Hipsman F., Ball I. (2015). Fifty Years On, the 1965 Immigration and Nationality Act Continues to Reshape the United States. Migration Policy Institute (MPI). Available at: https://www.migrationpolicy.org/article/fifty-years-1965-immigration-and-nationality-act-continues-reshape-united-states
- CIA World Factbook (2015). Central Intelligence Agency. Available at: https://www.cia.gov/library/publications/the-world-factbook/
- Congress (1996). Illegal Immigration Reform and Immigrant Responsibility Act of 1996. Washington, DC: Government Publishing Office. Available at: https://www.congress.gov/104/crpt/hrpt828/CRPT-104hrpt828.pdf
- Del Real, J.A. (2018). The Number of Undocumented Immigrants in the U. S. Has Dropped, a Study Says. Here are 5 Takeaways. The New York Times. Available at: https://www.nytimes.com/2018/11/27/us/illegal-immigrants-population-study.html.
- Homeland Security (2018). Yearbook of Immigration Statistics. Available at: https://www.dhs.gov/about-dhs
- Izyumov A. I. (2010) “Human Costs of Post-communist Transition: Public Policies and Private Response,” Review of Social Economy 48(1): pp.94–125.
- Meckler, L. (2017). Trump Administration Tightens Scrutiny of Skilled Worker Visa Applicants. The WallStreet Journal.
- Passel J. S. and Suro, R. (2005). Rise, Peak, and Decline: Trends in U. S. Immigration 1992–2004. Washington, DC: Pew Hispanic Center.
- Rosstat (2010) The Demographic Yearbook of Russia [Demographicheskiy Ezhegodnik Rossii], Moscow: Federal State Statistics Service, p. 402. Available at: http://www.gks.ru/doc_2010/demo.pdf
- Scherbakova E. (2012) Demographic summary of 2011 (Part 3). Demoscope Weekly № 501–502. Available at: http://www.demoscope.ru/weekly/2012/0501/barom01.php
- Vishnevskiy A. G., Zaionchkovskaya Zh. A., Denisenko M. B., Mkrtchyan N. V. (2017). “Migration”. [Migratsiya] Demographic Challenges of Russia. [Demographicheskie vyzovy Rossii]. Demoscope Weekly № 753–754. Available at: http://www.demoscope.ru/weekly/2017/0753/tema02.php
- Zhao, X. (2016). Immigration to the United States after 1945. Santa Barbara: University of California. Available at: http://oxfordre.com/americanhistory/view/10.1093/acrefore/9780199329175.001.0001/acrefore-9780199329175-e-72
Похожие статьи
English and Turkmen pronunciation: common errors and their causes
In our research we study pronunciation problems of Turkmen studients that connected with their interference peculiarites. The aim of our research was to compare English and Turkmen phonetics. To achieve this goal we used such methods as observation, questionnaire and recording test.
Креолизованный текст как особый вид паралингвистически...
Изменение в стандартных и проблемных областях любой из ныне существующих наук всегда представляется закономерным. По словам Т. Куна, научные революции рассматриваются «как такие некумулятивные эпизоды развития науки, во время которых старая парадигма...
Social project planning of the structure of the occupational guidance...
The article is based on the author's conclusions, which is based on the theory of the Soviet psychologist Klimov E. A. The article presents a project model of occupational guidance in the system of university degree.
Моделирование системы «АИН ШИМ – АД» с переменными ψr - is...
Моделирование системы «АИН ШИМ – АД» с переменными ψr - is в Matlab и Си. Емельянов Александр Александрович, старший преподаватель; Бесклеткин Виктор Викторович, старший преподаватель; Блинов Егор Константинович, студент; Кадцын Кирилл Павлович, студент...
К пониманию работы векторного модулятора на примерах
К пониманию работы векторного модулятора на примерах. Емельянов Александр Александрович, доцент; Пестеров Дмитрий Ильич, студент; Гусев Владимир Михайлович, магистрант.
Оценка качества передачи речи в IP-телефонии | Молодой ученый
В статье рассматриваются методы оценки качества передачи речи в сетях IP-телефонии, с целью минимизировать затраты на повторную оценку, при изменении факторов влияния. Обоснован выбор метода оценки качества. Составлена сравнительная характеристика...
Сравнение одно-диодных и двух-диодных моделей...
В этой статье предложены, сравнения между одно-диодной и двух-диодной моделями фотоэлектрических (ФЭ) модулей. Основной задачей этой работы точность, определение неизвестных параметров, и время выполнения неизвестных параметров, под стандартными...
Ускорение расчета динамического напряженно-деформированного...
Рассмотрен подход к ускорению расчета динамического напряженно-деформированного состояния с использованием графических сопроцессоров и стандарта OpenCL. Реализована вычислительная программа-прототип расчета для пластины с разными вариантами реализации...
Моделирование системы АИН ШИМ – АД с переменными...
Моделирование системы АИН ШИМ – АД с переменными в неподвижной системе координат αβ на основе апериодических звеньев. Емельянов Александр Александрович, доцент; Бесклеткин Виктор Викторович, ассистент; Авдеев Александр Сергеевич, студент...
Об имитационном моделировании экономических процессов...
Имитационное моделирование является мощным средством исследования разнообразных систем. Такой способ позволяет без материального эксперимента спрогнозировать поведение системы и получить разнообразные варианты как исходных, так и результирующих данных.


